


Trends in Cattle Finishing Breakeven Prices and Net Returns
Purdue ag economists use trends in cost of gain, breakevens and net returns to provide feedlot outlook through 2027.
August 5, 2026

by Michael Langemeier, Purdue University
Cattle finishing is a tight-margin business where profitability relies on feeder-cattle prices relative to fed-cattle prices and feed costs. This means relatively high fed-cattle prices, like we are experiencing in 2026, or relatively low feed costs do not necessarily translate into strong net returns. This article examines trends in feeding cost of gain, breakeven prices, and net returns for the last 10 years.
Several data sources were used to compute net returns. Average daily gain, feed conversion, days on feed, in weight, out weight, and feeding cost of gain were obtained from monthly issues of the Focus on Feedlots newsletter. Futures prices for corn and seasonal feed conversion rates were used to project feeding cost of gain for the next several months. Net returns were computed using feeding cost of gain from monthly issues of the Focus on Feedlots newsletter, fed-cattle prices and feeder-cattle prices reported by the Livestock Marketing Information Center (LMIC), and interest rates from the Federal Reserve Bank of Kansas City.
Feeding cost of gain
Fig. 1 illustrates monthly feeding cost of gain from January 2016 to May 2026. Feeding cost of gain has been more than $100 per hundredweight (cwt.) since June 2021. During the first eight months of 2023, feeding cost of gain was more than $140. So far in 2026, feeding cost of gain has ranged from $101 to $104. Given current corn and alfalfa projections, feeding cost of gain is expected to remain in the $100 to $105 range for the rest of the year.
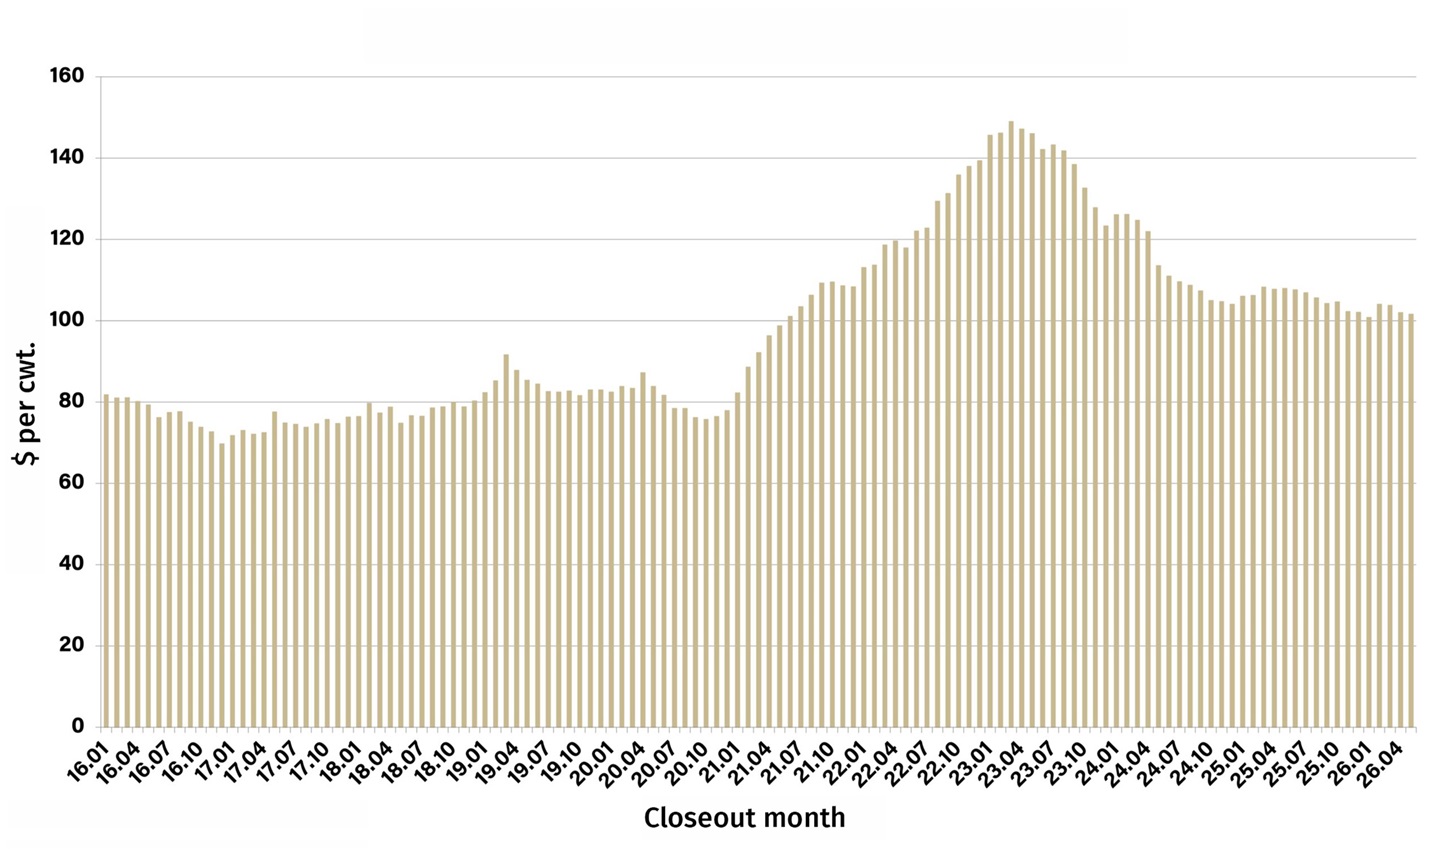
Fig. 1: Feeding cost of gain for steers, Kansas
Source: Focus on Feedlots newsletter

Feeding cost of gain is sensitive to changes in feed conversions, corn prices and alfalfa prices. Regression analysis was used to examine the relationship between feeding cost of gain, and feed conversion, corn prices and alfalfa prices. Results are as follows:
- each 0.10 increase in feed conversion increases feeding cost of gain by $2.08 per cwt.;
- each $0.10-per-bushel (bu.) increase in corn prices increases feeding cost of gain by $0.99 per cwt.; and
- each $5-per-ton increase in alfalfa prices increases feeding cost of gain by $0.54 per cwt.
In terms of explaining the variation in historical feeding cost of gains, changes in corn prices explain about two-thirds of the variation.
Feeder-to-fed-cattle price ratio
The ratio of feeder to fed-cattle prices since January 2016 is illustrated in Fig. 2. Since January 2016, this ratio averaged 1.242. The feeder-to-fed-cattle price ratio was one standard deviation below (above) the average for 21 (19) months since January 2016. The average net return for the months in which the ratio was below one standard deviation of the average was $106 per head. In contrast, the average loss for the months in which the ratio was above one standard deviation was $201 per head. The average ratio for the eight months with a feeder-to-fed-cattle price ratio above one standard deviation of the long-run average was 1.45. This ratio ranged from 1.42 to 1.54 from November 2025 to March 2026 before dropping to 1.35 in April and May of this year. As noted below, the relatively high feeder-to-fed-cattle price ratio from November 2025 to March 2026 resulted in cattle finishing losses. The lower ratios in April and May translated into positive net returns. Looking ahead, the feeder-to-fed-cattle price ratio is expected to remain above the long-run average for the rest of 2026 and into 2027.
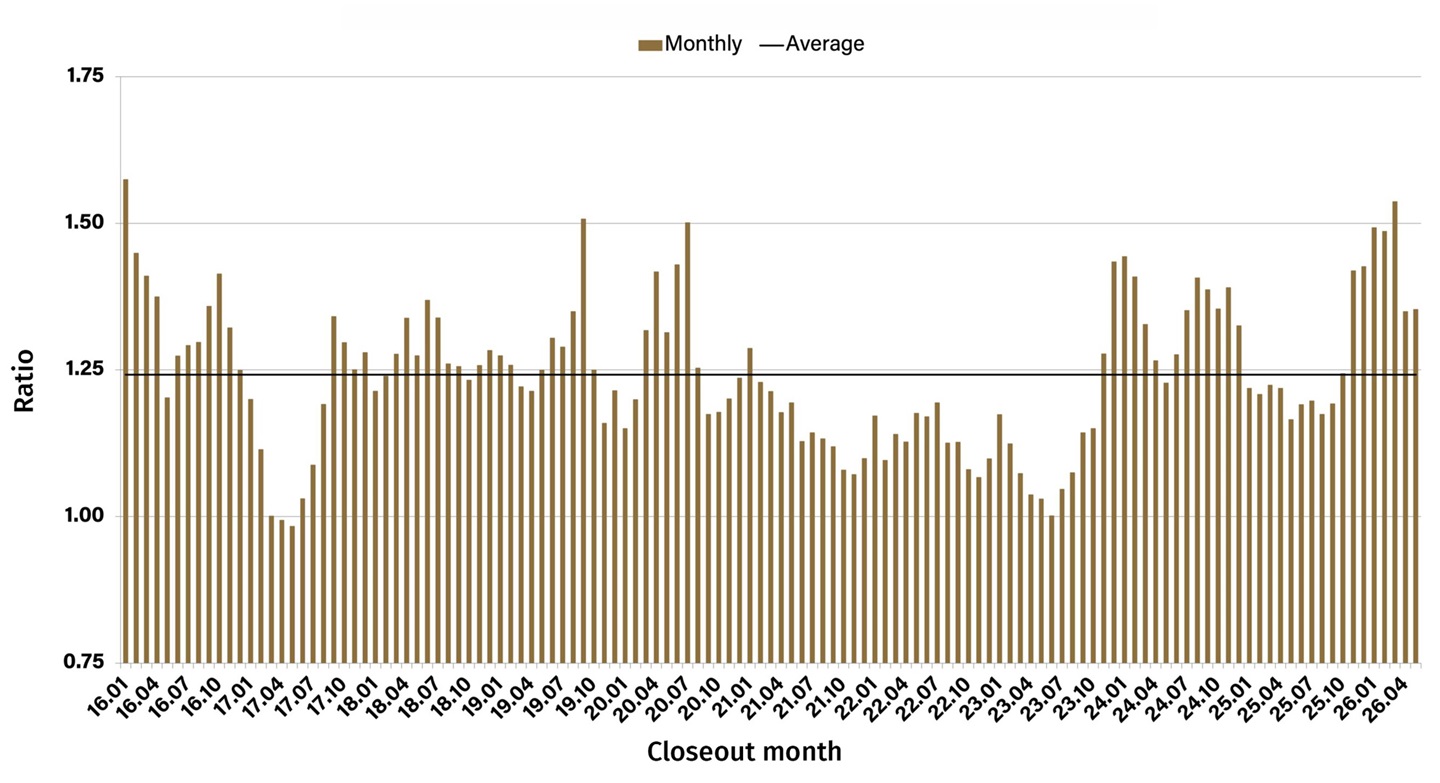
Fig. 2: Ratio of feeder prices to fed-cattle prices, Kansas

Breakeven prices and net returns
Monthly steer finishing net returns from January 2016 to April 2026 are presented in Fig. 3. It is important to note that net returns were computed using closeout months rather than placement months. The period from January 2025 to October 2025 was the most profitable period during the last 10 years. The average net returns ranged from $143 to $541 per head and averaged $312 per head. After experiencing net losses from December 2025 through March 2026, net returns were positive in April ($204 per head) and May ($297 per head). Moreover, net returns are expected to also be positive in June.
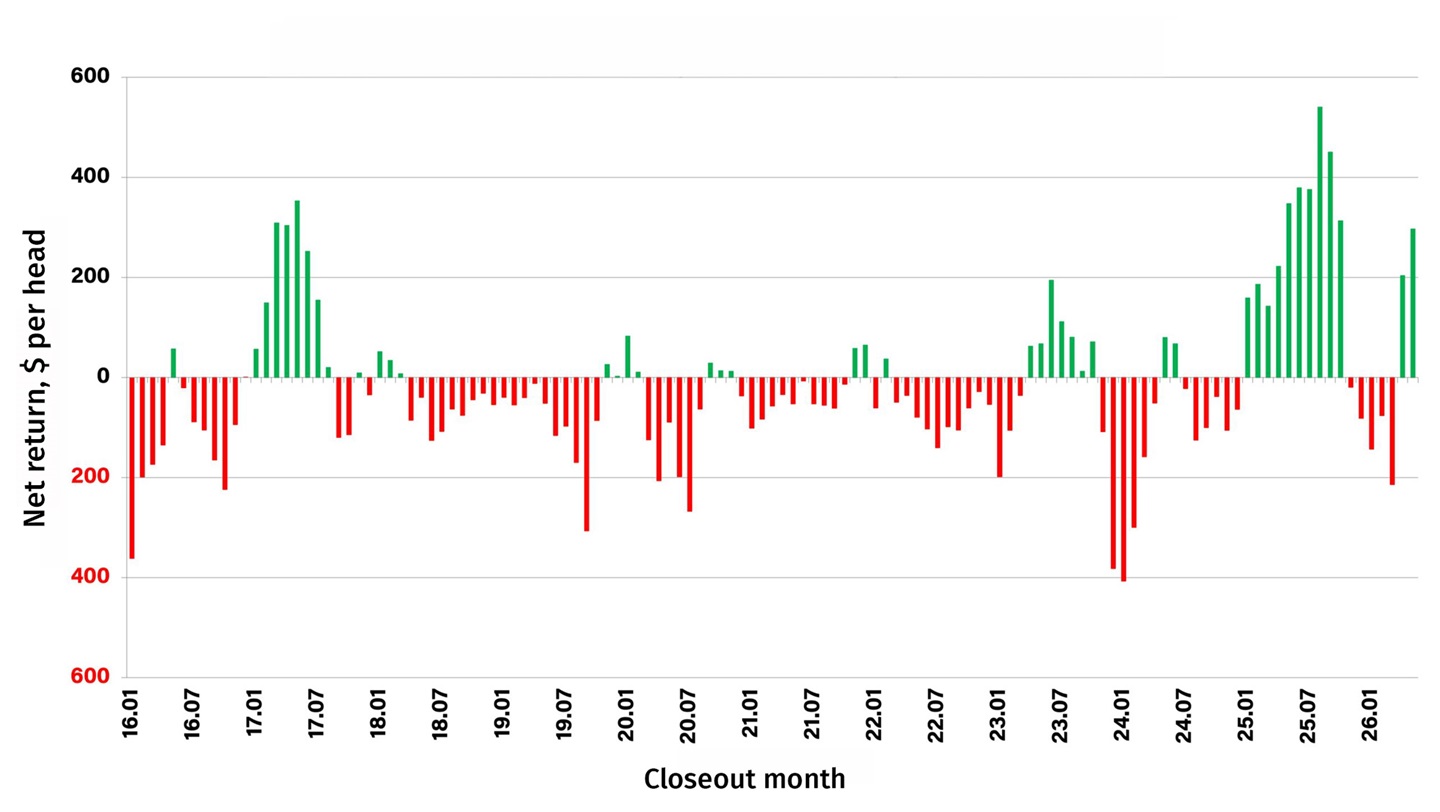
Fig. 3: Historical net returns for finishing steers, Kansas
Source: Michael Langemeier, Purdue University

The feeder-to-fed-cattle price ratios for the rest of 2026 and the first six months of 2027 are expected to be relatively high. Rather than focus on net return projections, we will provide expected breakeven prices below. Of course, these breakeven prices incorporate expected feeder-to-fed-cattle price ratios, as well as cost-of-gain projections.
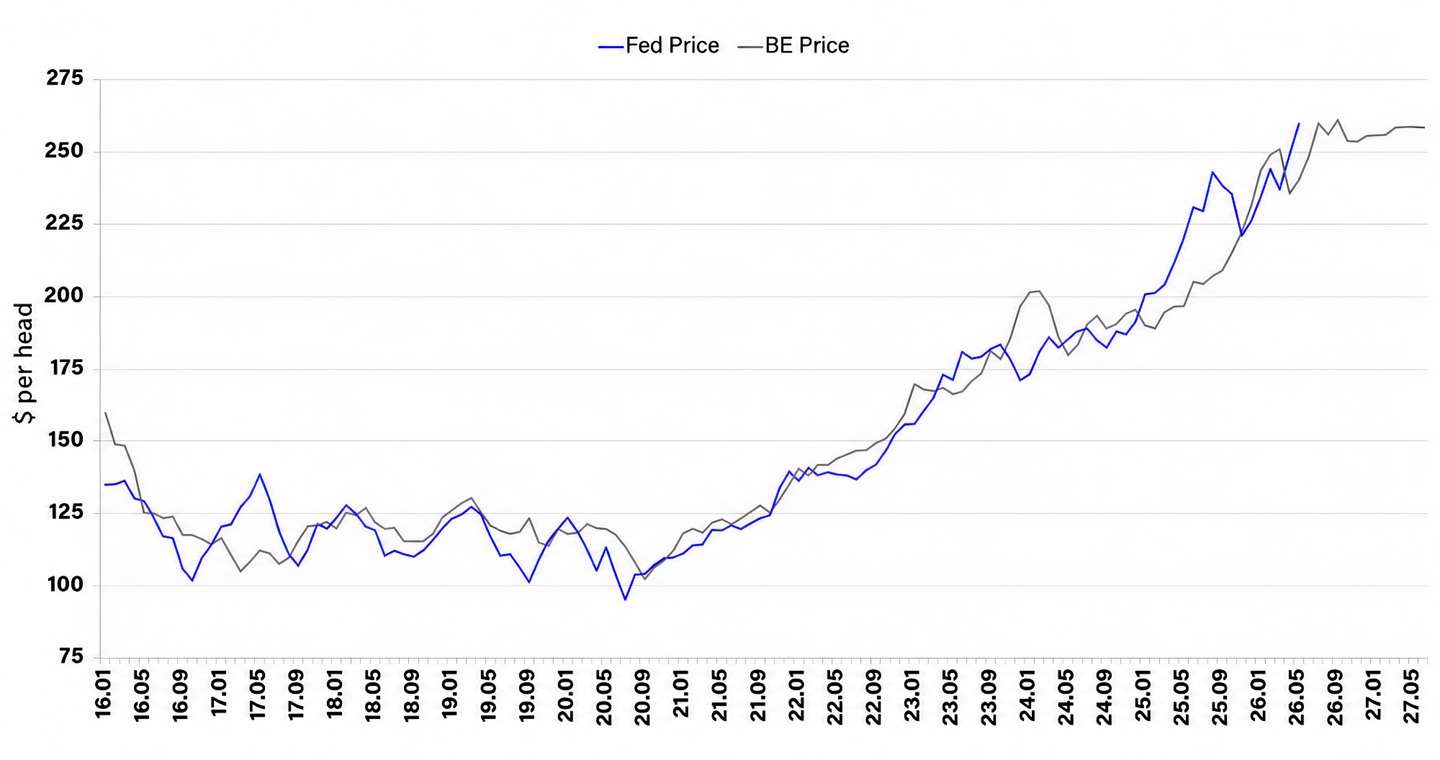
Fig. 4: Fed-cattle and breakeven prices, Kansas
Source: Michael Langemeier, Purdue University

Historical and breakeven prices for the last 10 years, as well as projected breakeven prices through June 2027 are illustrated in Fig. 4. The breakeven price ranged from approximately $102 to $149 per cwt. from February 2016 to September 2022. Breakeven prices have been above $150 per cwt. since October 2022. After averaging $174 in 2023 and $192 in 2024, breakeven prices averaged $205 in 2025.
The breakeven price in the first quarter of 2026 was approximately $248. Breakeven prices for the second quarter of 2026 are expected to average $242. Breakeven prices for the last six months of 2026 and the first six months of 2027 are expected to exceed $250, which is in uncharted territory.
Combining breakeven prices with USDA-Economic Research Service (ERS) fed-cattle price projections results in net returns in the last six months of 2026 and the first six months in 2027 that range from a negative $100 to breakeven. Due to the amount of uncertainty related to the current market environment, our typical caveats apply to these projections. Net return prospects could change rapidly.
Conclusions
This article discusses recent trends in feeding cost of gain, the feeder-to-fed-cattle price ratio, breakeven prices and cattle finishing net returns. Average cattle finishing net returns in 2025 were estimated to be approximately $250 per head. Current breakeven and fed-cattle price projections suggest the cattle finishing sector could experience net losses in the second half of 2026.
Editor’s note: Michael Langemeier is professor of agricultural economics and director of the Center for Commercial Agriculture at Purdue University. [Lead photo by Bilanol from Getty Images.]
Citations:
- Focus on Feedlots, Animal Sciences and Industry, Kansas State University, www.asi.k-state.edu/about/newsletters/focus-on-feedlots, accessed July 6, 2026.
- Livestock Marketing Information Center, ww.lmic.info/, accessed July 6, 2026.
USDA-ERS. “Livestock, Dairy, and Poultry Outlook: June 2026.” LDP-M-384, June 17, 2026.
Angus Beef Bulletin EXTRA, Vol. 18, No. 8-A
Topics: Feedyard , Industry News , Marketing , News
Publication: Angus Beef Bulletin
Related Content



Current Angus Beef Bulletin
Our November issue focuses on the females of the herd and the records that validate them.