



Ag Injury Resource
University of Illinois researchers develop interactive tool to track agricultural injuries, strengthen prevention efforts.
October 21, 2026

by University of Illinois Extension
Agriculture is one of the most dangerous occupations in the United States. Each year, vehicles, machinery, environmental hazards and other incidents cause thousands of injuries and hundreds of fatalities. A thorough understanding of the main risks is key to preventing accidents and promoting ag safety.
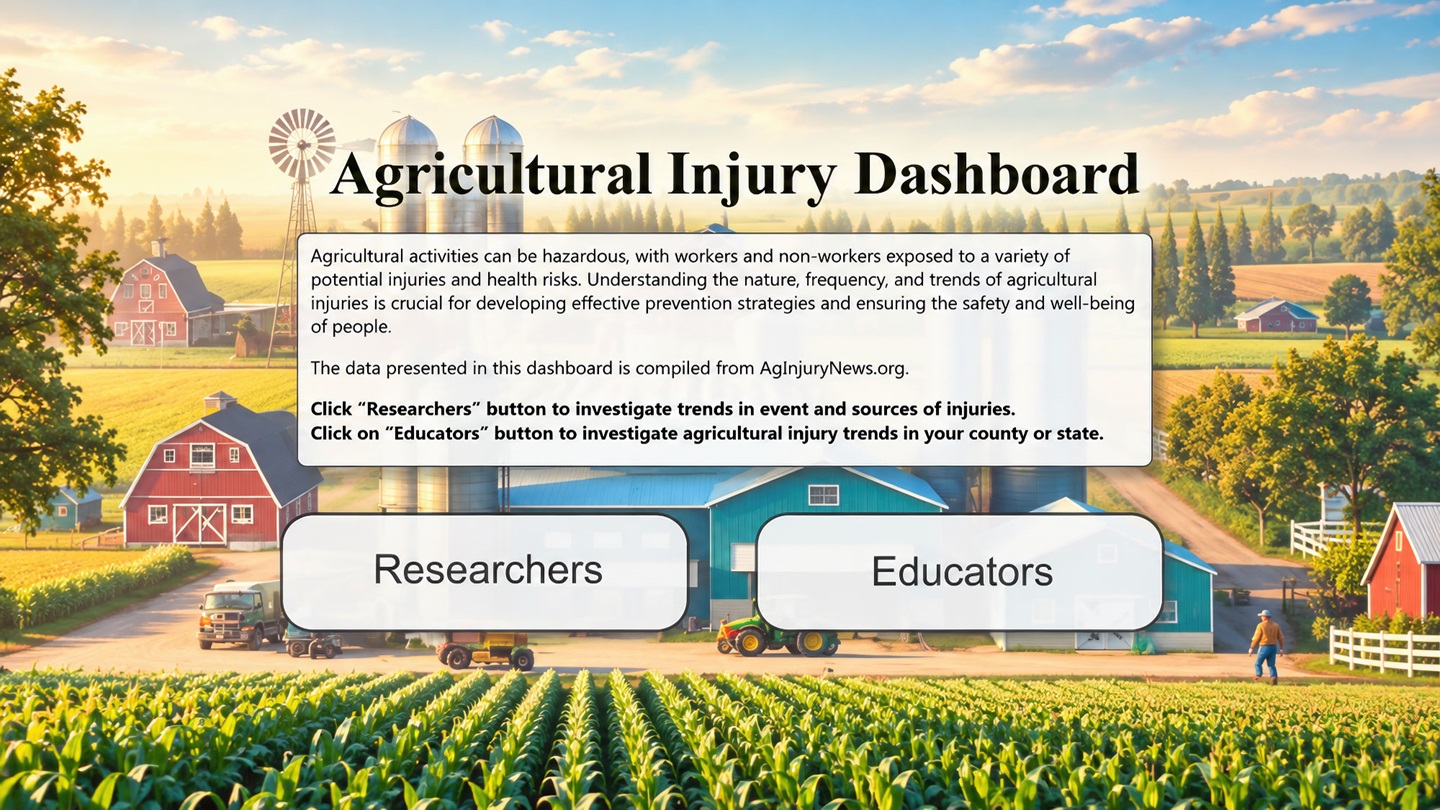
A research team at the University of Illinois Urbana-Champaign (U of I) has developed an interactive platform that allows users to obtain customized information about agricultural injuries. The researchers describe their work in a Journal of Agromedicine article.
The Agricultural Injury Dashboard allows users to search on a variety of parameters and provides the information as interactive graphs and charts.
“The project started as a tool for extension educators. We wanted to develop something they can use to learn more about the agriculture injuries in their own communities and to compare different regions,” says co-author Salah Issa, Illinois Extension specialist and associate professor in the Department of Agricultural and Biological Engineering (ABE), part of the College of Agricultural, Consumer and Environmental Sciences (ACES) and The Grainger College of Engineering at the U of I. “Eventually, we decided to also include search options for researchers, who may have different data demands.”
The Agricultural Injury Dashboard covers ag injuries in five Midwestern states. It contains tracks for researchers and educators to customize their queries according to specific purposes. The dashboard allows users to search on a variety of parameters and provides the information as interactive graphs and charts.
“Everything is interactive. If you click on any given year and a certain type of injury, every chart will highlight that specific injury type and provide the age, gender and fatality distribution. These charts work in tandem, which allows you to hone in on the data according to your needs,” says lead author Sihan Li. She helped develop the dashboard as a doctoral student in ABE and now continues the work as a visiting extension outreach associate.
Read the full article from the College of Agricultural, Consumer and Environmental Sciences at the University of Illinois Urbana-Champaign.
Editor’s note: [Lead image by College of ACES.]
Angus Beef Bulletin EXTRA, Vol. 18, No. 10-B
Topics: Industry News , Human Health , Management , News
Publication: Angus Beef Bulletin
Related Content


Current Angus Beef Bulletin
Our November issue focuses on the females of the herd and the records that validate them.