SIMPLE TO USE. EASY TO UNDERSTAND
Genetic Merit Scorecard℠ gives producers the ability to effectively communicate the genetic merit of their calves to potential buyers and differentiate their calves from others’ on sale day. The program also serves as a platform to track genetic progress to make sure the next calf crop is better than the last.
Get Started
What It Is
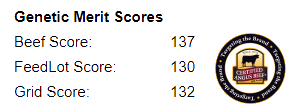
Genetic Merit Scorecard helps raise awareness of the genetic potential of your calves. The scoring system conveys a genetic snapshot utilizing the breeding history of your herd into three specific scores. Those scores range from 0 to 200. The higher the score, the better the genetic potential of the group of calves. The GM Scorecard allows buyers, year in and year out, to consistently choose cattle that have documented information on how your calves can potentially gain and grade.
In addition, the Genetic Merit Scorecard can provide you the tools to benchmark the genetic progress of your calves and aim for the targets feedyard buyers want. It takes time, financial investment, good bull selection criteria and excellent management to deliver consistent results. The Scorecard helps you document your progress for long-term profitability.
How It Works
Groups of calves or yearlings enrolled in Genetic Merit Scorecard will receive three scores designed to determine their genetic merit, based on the sires, as well as the genetic makeup of the cow herd. The cow-side contribution is based on a description of their breed composition (example: 80% Angus, 20% Hereford), and the genetic merit of bulls used historically that have influenced the heifers you have retained in your herd as replacement females.
What do the scores mean?
Each of the three scores are on a scale of 0-200 with a score of 100 representing the industry average.
The three scores are derived from your current bull battery, your past bull battery and the breed composition of your cow herd. The more information provided the more accurate the genetic prediction of your score.
Beef Score
Predicts genetic potential for feedlot performance and carcass value by looking at EPDs such as carcass weight, marbling and feed efficiency.
Feedlot Performance Score
Signifies the enrollment group's potential for post-weaning performance in the feedlot and takes into account average daily gain and dry matter intake EPDs.
Grid Score
Predicts the enrollment group's performance potential for carcass grid merit, referencing marbling, fat and ribeye area EPDs.
Example Scorecard
Score Improvement
The AngusLink scores’ foundation is based on the American Angus Association $Value indexes: $B (beef score), $F (feedlot performance score) and $G (grid score). The $Values are built from current EPDs, which are built from actual carcass data.
- To raise Beef Score, select for higher $B.
- To raise Feedlot Performance, select for higher $F.
- To raise Grid Score, select for higher $G.
Target the Brand

The Certified Angus Beef® brand Targeting the Brand™ logo appears on the scorecard when enrollment groups meet the phenotypic and genetic specifications listed below:
Phenotype
Each animal in the marketing group must be predominantly solid black and meet the live-animal specification for Angus branded programs. For more information see Carcass Specifications for Approved Programs.
Genetic
Enrollment groups earn a grid score of 125 or higher.
